


Wonderful Introduction:
Life is full of dangers and traps, but I will never be afraid anymore. I will always remember. Be a strong person. Let "strong" set sail for me and always accompany me to the other side of life.
Hello everyone, today Avatrade Aihua Foreign Exchange will bring you "[Avatradescn]: The US dollar index reversal, gold rides on a roller coaster, Trump and Musk openly scold each other." Hope it will be helpful to you! The original content is as follows:
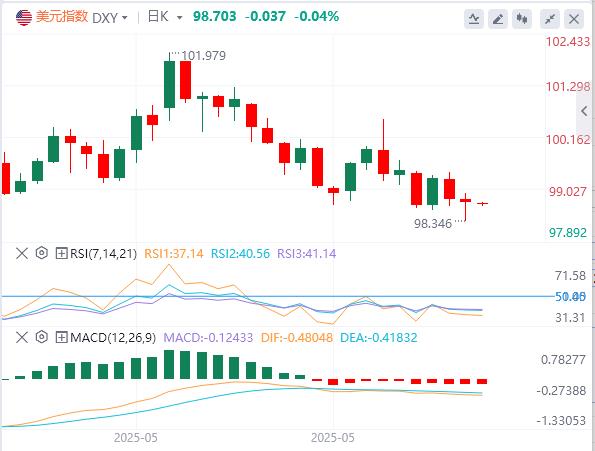
On June 6, early trading in Asian market on Friday, Beijing time, the US dollar index hovered around 98.82. On Thursday, the heads of Chinese and US dollars talked on the phone, and the US dollar index reversed V-shaped reversal, but remained below the 99 mark, and finally closed down 0.42% to 98.813. U.S. Treasury yields rose collectively, with the benchmark 10-year U.S. Treasury yields closed at 4.391%, and the 2-year U.S. Treasury yields closed at 3.928%. Spot gold took a roller coaster ride, and after hitting the $3,400/ounce mark during the session, it took a sharp turn and fell, giving up all the gains in the day, and finally closed down 0.58% to close at $3,352.83/ounce; spot silver performed strongly, standing above the $36/ounce mark for the first time since February 2012, and finally closed up 3.33% to $35.65/ounce. As more news of the progress of trade agreements boosted demand outlook, international crude oil rose, with WTI crude oil hitting a maximum of $63.295 per barrel, eventually closing up 0.74% to $62.63 per barrel; Brent crude oil closed up 0.57% to $65.04 per barrel.
Analysis of major currencies
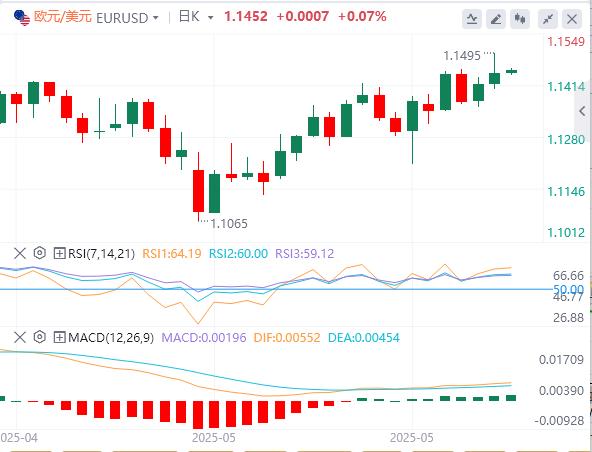
Dollar Index: As of press time, the US dollar index hovers around 98.70. The dollar could end a year-long easing cycle and U.S. data showed weak labor market conditions amid increasing economic resistance from tariffs. Although the dollar weakened against the euro, the dollar strengthened slightly against safe-haven currencies such as the yen and Swiss francs, reflecting possible position adjustments before the release of employment data. Technically, the closest resistance level of the US dollar index is in the range of 99.00–99.20. Breakthroughs above 99.20 will push the U.S. dollar index to the next resistance level100.20–100.40.
Analysis of gold and crude oil market trends
1) Analysis of gold market trends
On the Asian session on Friday, gold trading around 3359.51. Gold prices surged and fell on Thursday. Earlier intraday silver broke through the $35 mark, hitting a 13-year high, driving gold prices to rise above the 3400 mark, hitting a new high in the past four weeks to around $3403.28 per ounce. However, spot gold prices closed down 0.6% to $3352.65 per ounce due to signals of easing trade tensions released by the call between Chinese and US leaders. The market's attention has begun to turn to the upcoming U.S. non-farm employment data and the Federal Reserve's policy trends.
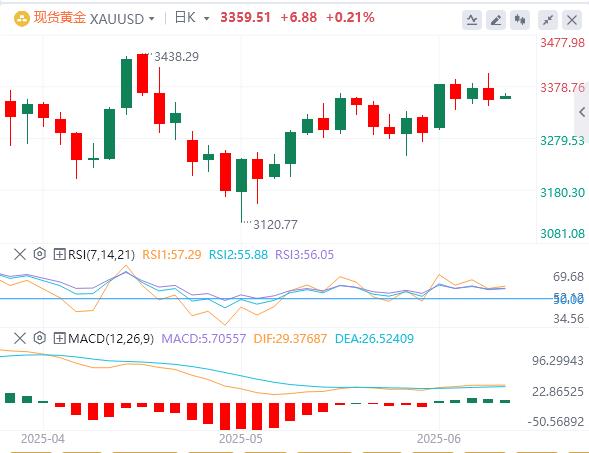
Technical: From the daily chart, gold is currently oscillating between the middle and upper tracks of the Bollinger Band, and the overall situation is still in the consolidation stage in the upward trend. After breaking through $3,300, the price was temporarily blocked at the $3,430 line. This level is the previous high area and is also the short-term resistance corresponding to the upper track of the Bollinger band. Analysts believe that if the subsequent volume exceeds US$3,430, it is expected to challenge the high of $3499.83 again. In terms of MACD indicators, the fast line (DIFF) and the slow line (DEA) are above the zero axis, showing a mild golden cross, the bar chart turns slightly red, and the kinetic energy begins to recover, suggesting that there is a possibility of further strengthening in the short term. The Relative Strength Index (RSI) is currently hovering around 58, and there is no overbought signal, indicating that the market sentiment is relatively neutral and is retaining space for subsequent rises. From the overall structure, gold shows a significant box oscillation pattern, with support level referring to the $3300 mark and resistance level focusing on the $3430 level; once it breaks through, the space above is expected to be further opened.
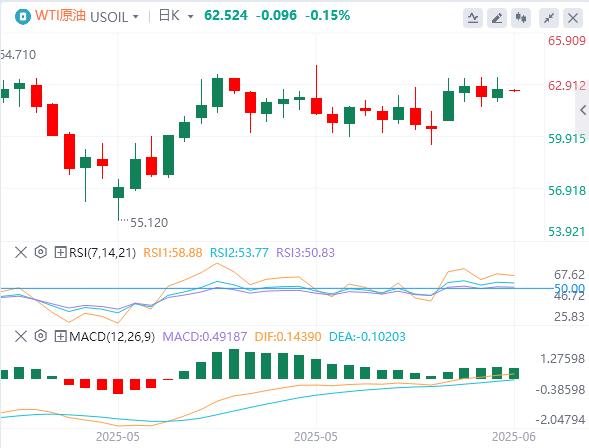
2) Analysis of crude oil market trends
On Friday, crude oil trading was around 62.52. The recent uptrend is fading as the market encounters technological resistance and demand concerns intensify. Price is still above the 50-day moving average of $62.40. However, the rally stagnated at $63.96, just below the key resistance levels of $64.19 and $64.40. If these levels rise above, it may open up a path towards the 200-day moving average of $68.72. Without follow-up follow-up, the market could face the risk of a lower pivot range between $62.59 and $59.51. The market's attention has begun to turn to the upcoming U.S. non-farm employment data and the Federal Reserve's policy trends.
Forex market trading reminder on June 6, 2025
14:00German April seasonally adjusted industrial output monthly rate
14:00German April seasonally adjusted trade account
14:00UK May Halifax seasonally adjusted house price index monthly rate
14:45France April industrial output monthly rate
14:45France April April trade account
17:00Eurozone first quarter GDP annual rate correction value
17:00Eurozone The final value of the quarterly adjusted employment rate in the first quarter
17:00 Eurozone April retail sales monthly rate
20:30 Canadian May employment
20:30 US May unemployment rate
20:30 US May seasonally adjusted non-farm employment
20:30 US May average annual wage rate
20:30 US May average monthly wage rate
20:30 US May average monthly wage rate
The next day 01:00 US to June 6
Total number of oil drilling rigs in the weekThe above content is all about "[Ava Avatrade Foreign Exchange]: The V-shaped reversal of the US dollar index, gold rides on a roller coaster, Trump and Musk openly scold the enemy" is carefully www.avaforexcn.compiled and edited by the Avatrade Foreign Exchange editor. I hope it will be helpful to your trading! Thanks for the support!
After doing something, there will always be experience and lessons. In order to facilitate future work, we must analyze, study, summarize and concentrate the experience and lessons of previous work, and raise it to the theoretical level to understand it.