


Wonderful Introduction:
Only by setting off can you reach your ideals and destinations, only by working hard can you achieve brilliant success, and only by sowing can you gain. Only by pursuing can one taste a dignified person.
Hello everyone, today Avatrade Aihua Foreign Exchange will bring you "[Avatradescn Forex Market Review]: Gold stages a V-countering trend! Popular candidates for the Federal Reserve Chairman publicly call for interest rate cuts." Hope it will be helpful to you! The original content is as follows:
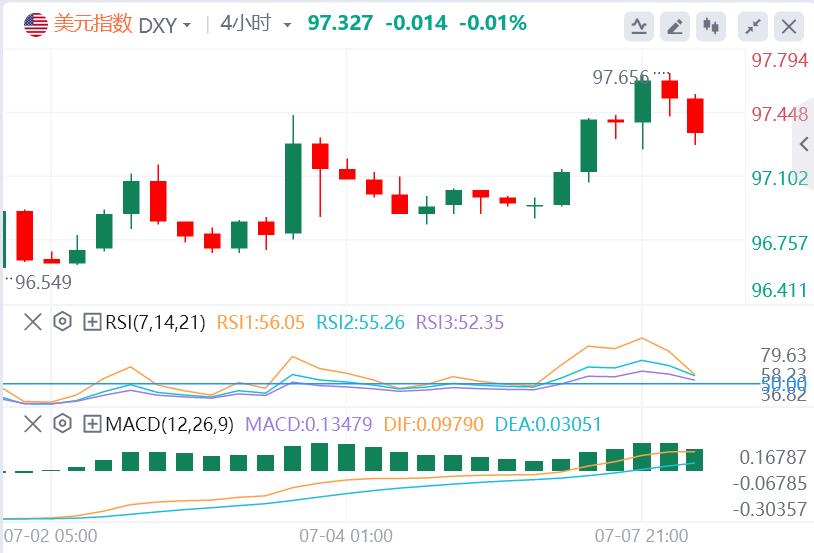
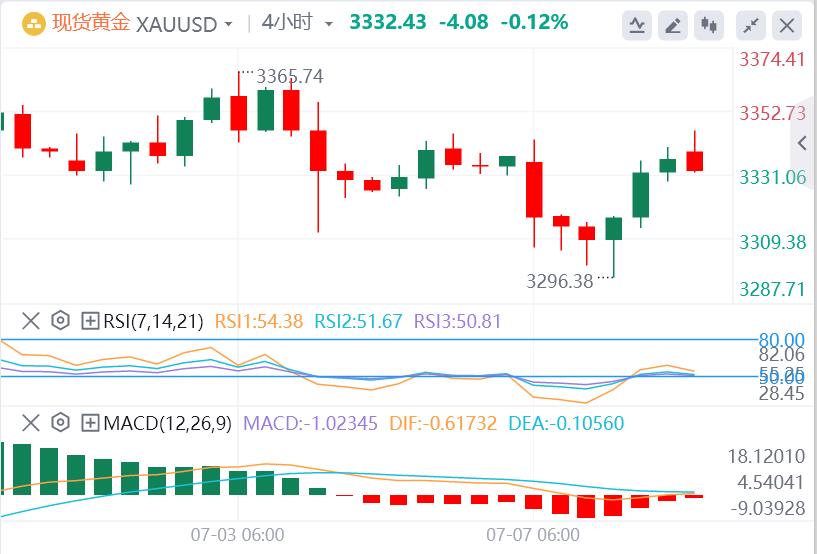
On July 8, early trading in the Asian market on Tuesday, Beijing time, the US dollar index hovered around 97.32. On Monday, the U.S. President Trump announced that he would impose new tariffs on a series of countries including Japan and South Korea on August 1, the U.S. dollar index rose sharply, once rising to a day-to-day high of 97.65, and finally closed up 0.58% to 97.51. The benchmark 10-year U.S. Treasury yield closed at 4.385%, while the 2-year U.S. Treasury yield closed at 3.897%. Spot gold fell first and then rose, and fell below the $3,300 mark during the session, but then it rebounded strongly by nearly $40, and finally closed down 0.02%, closing at $3,336.51/ounce; spot silver finally closed down 0.43%, at $36.74/ounce. The two oil rebounded sharply as signs of strong demand offset concerns that OPEC+'s exceeding expectations in August and the possible new impact of U.S. tariffs. WTI crude oil rose more than 2% during the day, and once rushed above $67 during the session, and finally closed up 2.11% at $67.01/barrel; Brent crude oil closed up 1.65% at $69.02/barrel.
Analysis of major currencies
Dollar Index: As of press time, the US dollar index hovers around 97.32. The short-term trend of the US dollar index will rely heavily on the breakthrough situation of key technical positions and the pace of implementation of fundamental events. Market participants need to pay close attention to the minutes of the Federal Reserve meeting, economic data and the progress of external events to capture the potential signals of the market turning point. Technically, if the U.S. dollar index successfully closes above the 97.50 level, it will move towards the next resistance level 98.00–98.20.
Analysis of gold and crude oil market trends
1) Analysis of gold market trends
On Tuesday, gold trading was around 3332.43. The gold market is in a www.avaforexcn.complex environment with multiple factors intertwined. Trump's tariff policy and the turmoil in US stocks provide safe-haven support for gold, while the continued purchase of gold by the People's Bank of China consolidates its long-term value. However, the short-term strength of the US dollar and the uncertainty of the Federal Reserve's policy may continue to limit the upward space of gold prices. In the short term, gold prices may fluctuate in the range of $3300 to $3400 per ounce, and investors need to pay close attention to the United Nationsminutes of meetings and geopolitical dynamics. In addition, this trading day will also release the forecast for the 1-year gold increase of the New York Fed in June and the 1-year inflation expectation of the New York Fed in June. Investors also need to pay attention to it, and also pay attention to the performance of the RBA interest rate resolution.
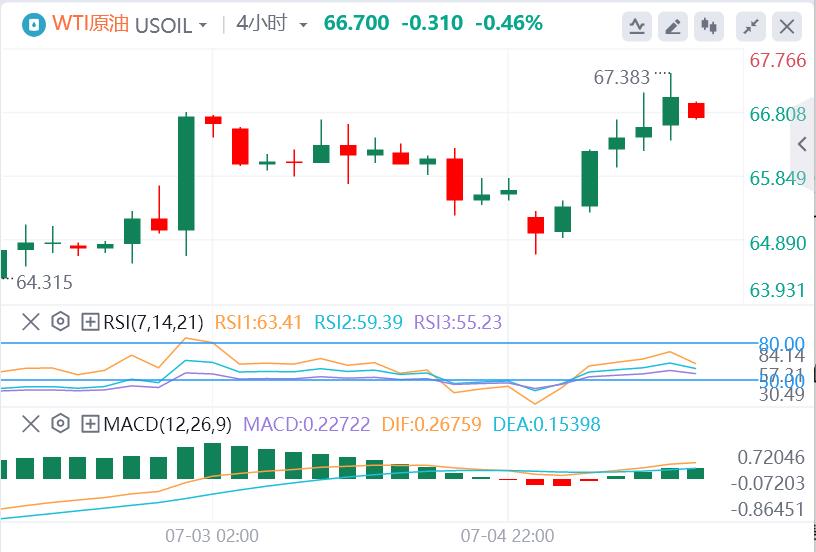
2) Analysis of crude oil market trends
On Tuesday, crude oil trading around 66.70. Oil prices rose nearly 2% on Monday as signs of strong demand offset concerns about the August increase in OPEC+ and the potential new impact of U.S. tariffs. Oil is under pressure as U.S. officials said they would postpone the start of tariff collection but failed to provide details of the change in tariff rates. Investors are concerned that higher tariffs may slow economic activity and oil demand. This trading day will also be released on the New York Fed's 1-year gold increase forecast in June and the New York Fed's 1-year inflation forecast in June. Investors also need to pay attention to it, and also pay attention to the performance of the RBA interest rate resolution.
Forex market trading reminder on July 8, 2025
12:30 RBA announced interest rate resolution
13:30 RBA Chairman Brock held a press conference
14:00 German May seasonal adjustment trade account
14:45 French May trade account
18:00 US June NFIB Small Business Confidence Index
23:00 US June New York The Fed's 1-year inflation expectation
EIA released its monthly short-term energy outlook report
The next day, 04:30, the next day, the API crude oil inventories from the United States to July 4
The above content is about "[Ava Aihua Foreign Exchange Market Review]: Gold stages a V-counter-trade! Popular candidates of the Federal Reserve Chairman publicly call for interest rate cuts". It was carefully www.avaforexcn.compiled and edited by the Avatrade Foreign Exchange editor. I hope it will be helpful to your trading! Thanks for the support!
Spring, summer, autumn and winter, every season is a beautiful scenery, and it stays in my heart forever. Leave~~~